


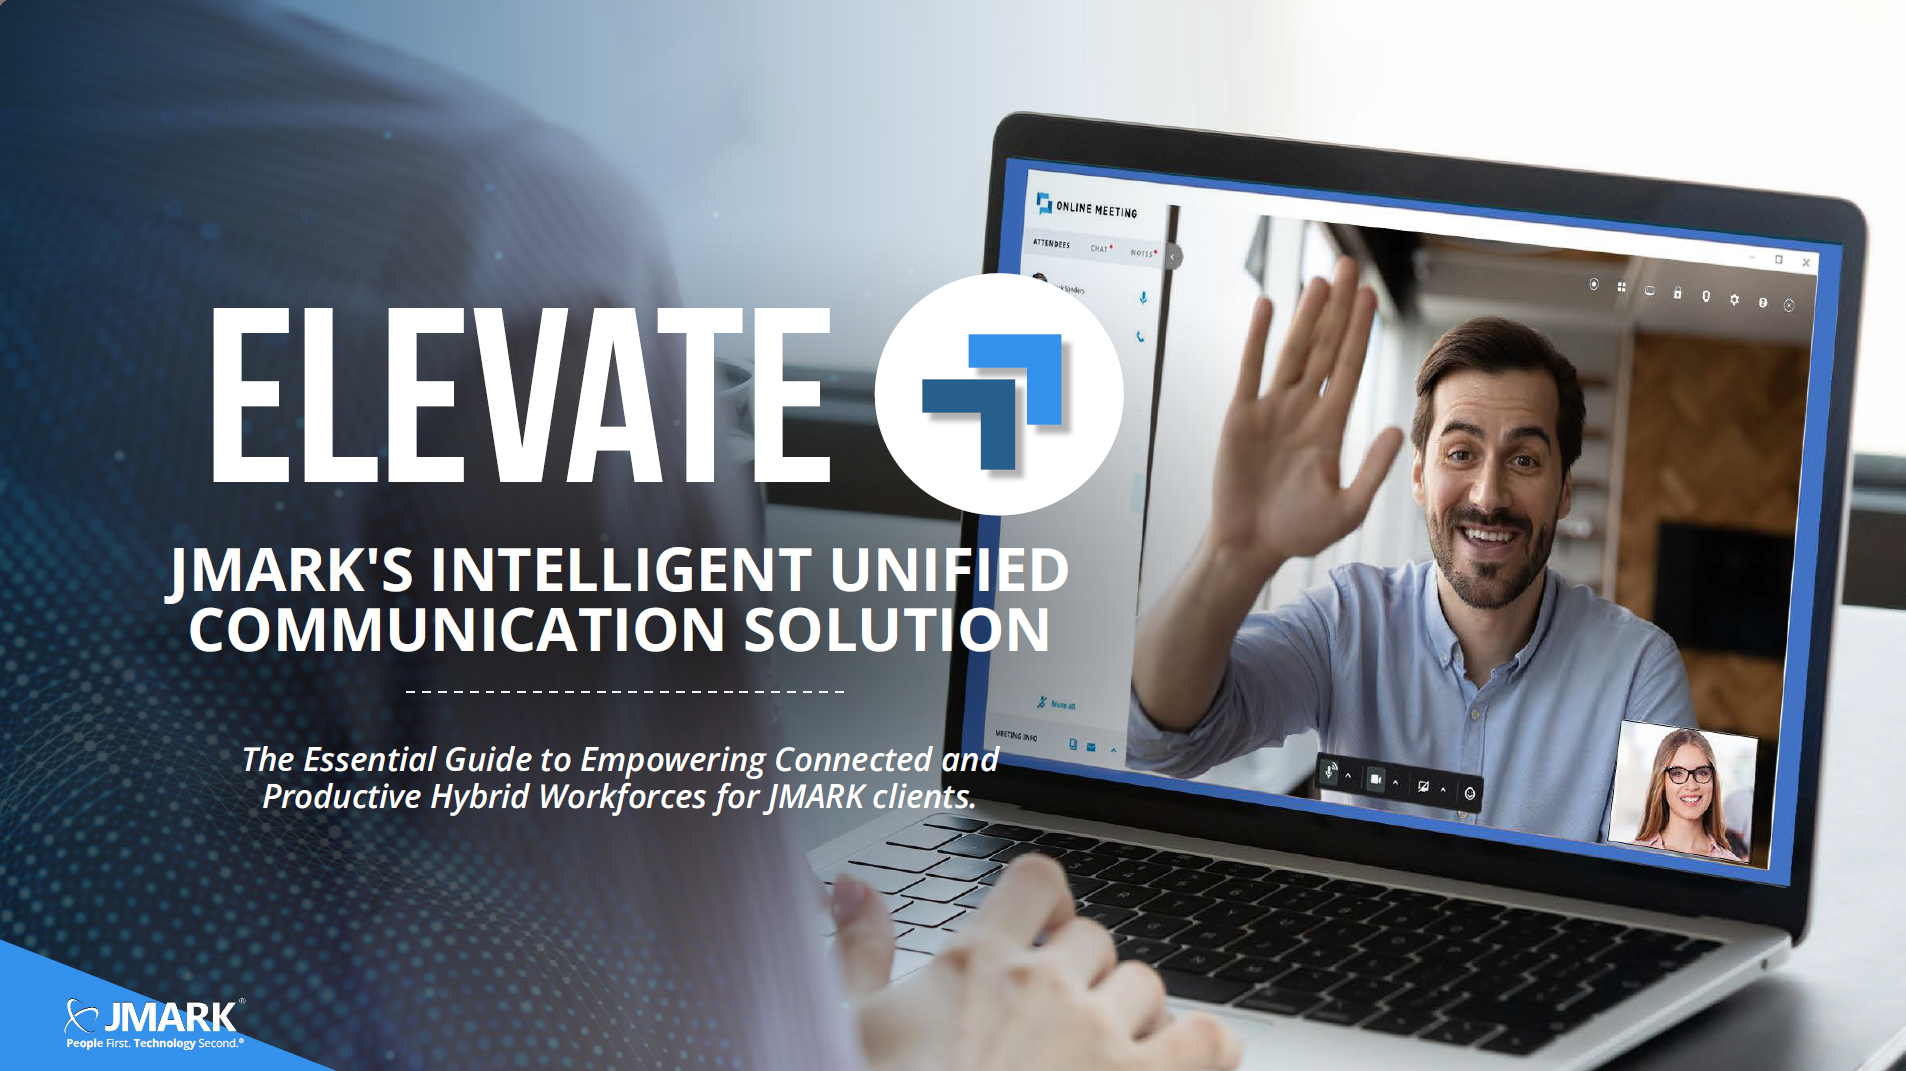
Elevate - JMARK's Intelligent Unified Communication Solution
Introduction No matter where you work, consistent and reliable communication is essential for any business. Your communication pathways, platforms,...
Updated April 29, 2026
15 min read

Introduction No matter where you work, consistent and reliable communication is essential for any business. Your communication pathways, platforms,...

Introduction Every leader has that moment. Maybe it’s the second hour into an audit or the third “urgent” email from IT this week. You look at the...
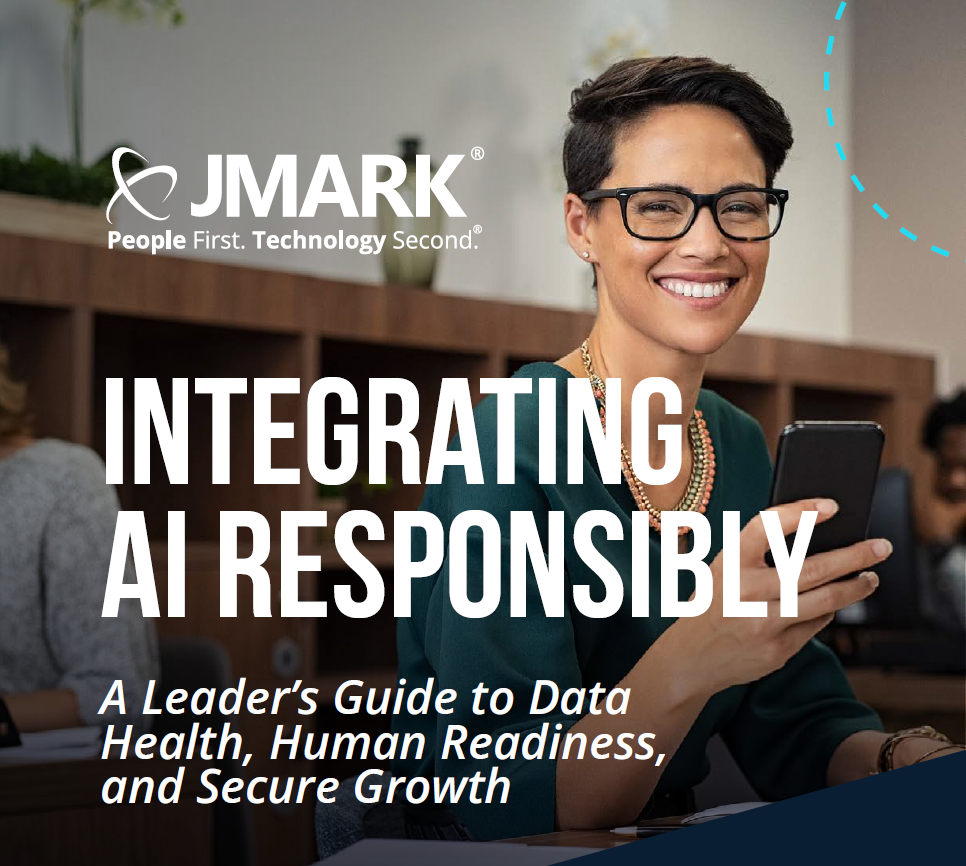
Executive Perspective Business leaders now field specific pitches about AI-enabled forecasting in their ERP systems, virtual assistants within their...